The System
- A manufacturing system is an objective-oriented network of processes through which entities flow. It is a network of interacting parts.
-
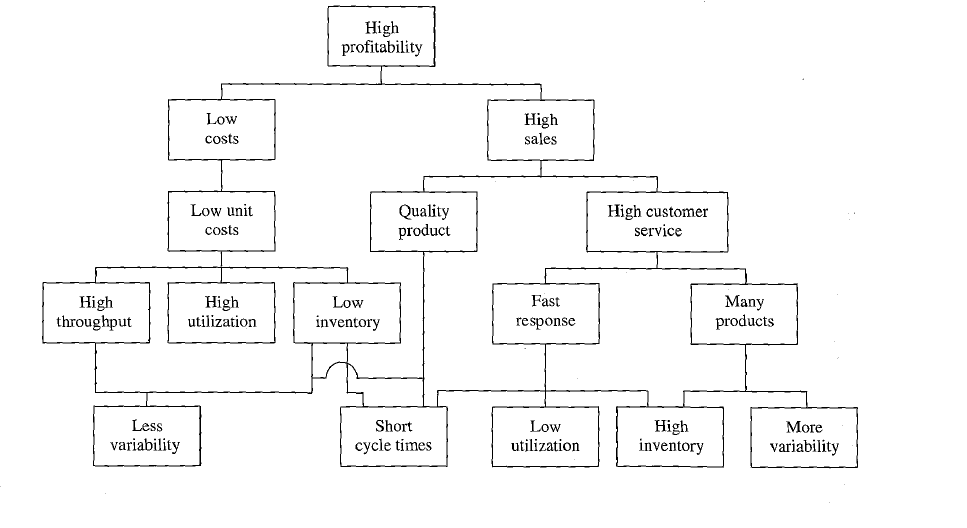
The fundamental objective is the broad goal everyone can agree on. A fundamental objective balances the desires of all involved parties.
-
Usually the fundamental objective will need to be narrowed down to establish compromises between all involved parties. Tradeoffs will also need to be done to meet conflicting objectives .
-
The fundamental metric of profit and ROI can be computed as follows
Revenue is generated through throughput — the amount of product sold. Assets focus on things we can control.
-
There are three basic assets we must be able to control
- Information - what is known about the system
- Control - operating policies that affect system behavior.
- Buffers - protections against variability
-
- We perform operations analysis to observe the actual system and develop a conceptual model.
- We make use of means-end analysis — The objective is always specified first, and then alternatives are sought and evaluated in terms of this objective. We seek creative alternatives and brainstorming should cover a broad range of ideas.
- We also seek to optimize and iteratively refine our objectives, alternatives, and models.
- We convert objectives to constraints via satisficing.
- Models require verification (checking the logic of the model) and validation (comparing the model to reality).
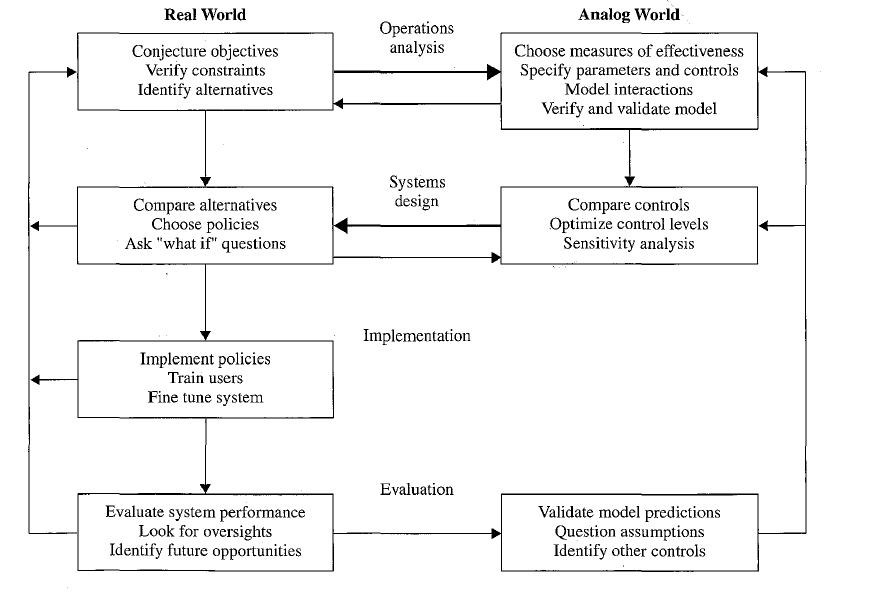
- Models allow us to quantify the tradeoffs that exist within the system.
- We can make use of accounting models and techniques to estimate the individual costs per product. This guides both long term and short term decisions.
- The need for accounting models arise due to overhead - costs not associated with products
- The value of limited resources depends on how they are used. Static cost-based models cannot assign costs to limited resources
- The primary purpose of models is to guide strategic decisions. Use different models for different problems as appropriates.
- Models allow us to perform risk analysis.
- The best policy is generally not obvious in advance
Fundamental Objects
-
A workstation is a collection of one or more machines or manual stations that perform essentially the same function.
- Process-Oriented layouts mean that workstations are physically organized organized according to the operations they perform.
- Product-Oriented Layouts mean that workstations are organized in lines making specific products
-
A part is a piece of raw material, subassembly or assembly that is worked on at the workstation. All parts used in the production of end items are listed in the bill of material.
- Raw Material refers to parts purchased outside the plant.
- Components are individual pieces assembled into more complex products.
- Subassemblies are assembled units that are further assembled into more complex products.
- Assemblies are fully assembled products or end items.
- End items are parts sold directly to a customer.
-
A consumable are materials used in workstations but do not become part of the sold product. Consumables are not listed in the bill of material.
-
Routing describes the sequence of workstations passed through by a part
-
An order is a request from a customer for a particular part number, in a particular quantity, to be delivered on a particular due date.
-
A job refers to a set of physical materials that traverses a routing, along with the associated logical information for their assembly.
-
Raw Material Inventory pertains to the physical inputs at the start of the process.
-
Crib Inventory is a stock point at the end of a routing for intermediate inventory.
-
Finished Goods Inventory is a stock point for end products.
-
Work In Process is the inventory between the start and end points of a product routing (but not including the start and end stock points). The WIP is not necessarily equal to the crib inventory.
-
The throughput
is the average (non-defective) output of a production process per unit time. -
The capacity is the upper limit on the throughput of a production process.
-
The station capacity can be computed as
-
In most cases, releasing work into the system at or above the capacity causes the system to become unstable
-
A line is balanced if all workstations have equal capacity.
-
-
Inventory turns pertain to a measure of efficiency with which inventory is used.
-
The turnover ratio is the ratio of throughput to average inventory.
-
The cycle time
of a given routing is the average time from release of a job at the beginning of the routing until it reaches an inventory point at the end of the routing -
The lead time of a given routing or line is the time allotted for production of a part on that routing or line. Because it is time allotted, it is controllable.
- The customer lead time is the amount of time allowed to fill a customer order from start to finish.
- Manufacturing Lead time pertains to a particular routing only.
-
The service level of a line is defined as
-
The fill rate is defined as the fraction of orders that are filled from stock
-
In a made-to-stock environment, the customer lead time is zero. When the customer arrives, the product either is available or is not (in which case, fill rate suffers).
-
In a made-to-order environment, the customer lead time is the time the customer allows the firm to produce and deliver an item.
-
The effective production rate is the maximum average rate at which the workstation can process parts.
-
The utilization of a workstation, denoted
is the fraction of time it is not idle for lack of parts. It is the probability that the station is not busy. -
The makespan is defined as the time it takes to finish a fixed number of jobs.
-
The bottleneck rate of a line, denoted
is the rate of the workstation having the highest long-term utilization. Long term means averaging out variances due to unforeseen events. *This dictates maximum throughout and capacity. - In lines with a single routing, the bottleneck will be the line with the least long term capacity. This does not apply for more complicated routings.
-
The raw process time, denoted
is the sum of the long-term average process times of each workstation in the line. Alternatively, it is the average time it takes a single job to traverse an empty line. - Over the long term, it includes infrequent delays.
- Over the short term, it includes the most frequent delays.
- This dictates minimum cycle time
-
The Critical WIP of a line, denoted
is the WIP level for which a line having no variability achieves maximum throughput with minimum cycle time. - *In a balanced line,
is equal to the number of machines on the line - In an unbalanced line
. Some machines are not fully utilized.
- *In a balanced line,
-
The state of the system is a complete description of the jobs at all stations.
- All states are equally likely when the following are met
- The line is balanced
- All stations are composed of single machines
- Process times must be random and occur in an exponential distribution. The distribution must satisfy the Markov Property
- All states are equally likely when the following are met
Performance Metrics
-
Throughput - the rate of parts produced by the line that are used. Ideally this exactly matches demand. Throughput efficiency is measured in terms of whether output is adequate to satisfy demand
-
Utilization - the faction of time a station is busy. The ideal has all workstations 100% utilized relative to the best possible rate (i.e., no detractors).
For a line with
stations, the utilization efficiency is given by -
Inventory includes the raw material inventory (RMI), finished goods inventory (FGI) and work in process (WIP) . The ideal will have no RMI, no FGI and only the minimum WIP for given throughput. The inventory efficiency is given by
-
Cycle Time is the time taken for a job to be finished from the moment it is received. Reducing cycle time reduces costs. The ideal is to match the best cycle time dictated by Little’s law operating on ideal throughput and ideal cycle time. The cycle time efficiency is given by
Note we are using the raw process time
with no detractors. -
Lead Time is the time quoted to the customer which is minimized for competitive reasons. The ideal raw process lead time is the ideal raw process time
. The lead time efficiency is given as
-
Customer Service is the fraction of demands satisfied on time. The ideal service level is dictated either using the fill rate (made-to-stock) or served orders (made-to-order). The service efficiency is given by
-
The quality is the fraction of parts made correctly the first time through the line. Ideally, all products are not reworked. The quality efficiency is given by