Aggregate Supply and Demand
-
An extension of Scarcity, Supply, and Demand from a Macroeconomics perspective applying to total supply and total demand.
-
The total quantity of output is measured via real GDP compared to each price level. The price level is the price for final goods bought in the economy.
-
The aggregate supply curve shows how producers as a group will respond to an increase in aggregate demand. Higher demand = more produced.
- Near the point of the potential GDP, the AS curve grows steeper.
- The level of production in aggregate supply can cross the potential GDP. In this case, the economy is working under hyper-intense production. However, this is not sustainable in the long run.
-
The aggregate demand refers to the total amount of domestic goods and services in the economy at each price level. Higher price level = Lower spending.
- Aggregate demand is dependent on consumption spending, investment spending, government spending, and net exports.
- There are three effects at play. These effects do not seem to be very large.
- The wealth effect means that as price increases, the buying power of savings diminishes.
- The interest rate effect means that as prices increase, the same purchases will take more money to accomplish. This pushes interest rates higher which reduces borrowing and investment spending.
- The foreign price effect means that a higher domestic price level relative to price levels in other countries will reduce net export expenditures.
-
The AS and AD curves intersect at the equilibrium point. At equilibrium we see the real GDP of the economy and the average price of all goods sold.
Shifts in Aggregate Supply and Demand
-
Like in the microeconomic model, shifts in aggregate supply and demand induces a change in the equilibrium point.
-
The following factors can affect aggregate supply
- In the long run, the most important factor shifting the AS curve is productivity growth. Productivity means that the same quantity of labor can produce more output (GDP) while at the same time lowering prices.
- Higher prices for inputs that are widely used (i.e., energy, rent, and labor) shifts the AS curve left. This induces less GDP and raises prices bringing a recession and higher unemployment.
- Supply shocks are sudden, unexpected events that induce a shift in the supply curve. For example, the effects of the weather, war, or a pandemic. Shocks tend to reduce aggregate supply at all price levels which also leads to shortages .
-
The following factors can affect aggregate demand.
- Any change in the factors affecting demand (see Keynesian Perspective) — consumer spending, investment spending, government spending, and net exports. An increase in these factors leads to an increase in total spending.
- Confidence in the economy plays a factor in increasing consumer and investment spending. More confidence = more spending = More output at a higher price level at equilibrium.
- Macroeconomic Policy concerning government spending or tax rates. Higher taxes / interest rates = Lower consumption.
Modeling The Whole Economy
- Key economic issues are illustrated in the AD/AS model
- Long-run economic growth due to productivity increases over time will be represented by a gradual shift to the right of aggregate supply
- Recessions occur when the real GDP is significantly below potential GDP. Conversely, economic growth means that the real GDP is closer to the potential GDP.
- Potential GDP can imply different unemployment rates in different economies, depending on the natural rate of unemployment for that economy
- Unemployment is measured by how close the economy is to full GDP employment level. The factors contributing to unemployment are implicitly part of potential GDP.
- If equilibrium is at the steep portion of the AS curve, then we have inflation. This can arise due to a shift in demand
- A shift in supply to the left is indicative of inflation. As a result, equilibrium GDP decreases while price levels increase.
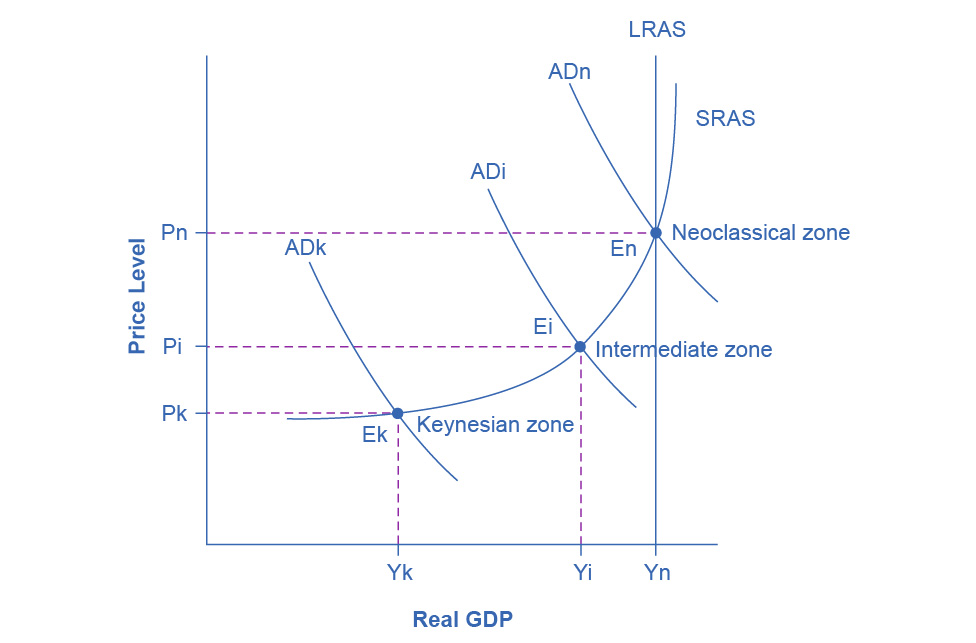
- In the Keynesian Zone, the SRAS curve is flat.
- The equilibrium level of real GDP is far below potential GDP
- The economy is in recession,
- Cyclical unemployment is high.
- Inflation becomes less of a concern here since price level does not vary.
- In the Neoclassical zone, the SRAS is steep.
- The equilibrium level of real GDP is close to potential GDP
- Demand shifts have little effect.
- Cyclical unemployment is low.
- Inflation becomes a concern as shifts in demand can raise price levels.
- In the Intermediate zone, we observe that unemployment and inflation move in opposite directions
Keynesian Perspective
-
Keynes’ Law: Demand creates its own Supply
- The economy often produced less than its full potential because there was no demand to incentivize production.
- Note that it does not take into account how the economy can be constrained by its production capabilities
- It is a good approximation of the short-term behavior of the economy.
-
Keynesians posit that the economy is often in the Keynesian Zone of the AS/AD model.
-
AD is volatile. It can fall to the recessionary gap where unemployment is high, or it can rise to the inflationary gap where the economy is in inflation’
-
There are three factors that can affect consumption expenditure
- Disposable Income - how much income they have after taxes.
- Expected future income - optimistic consumers are more likely to spend. This also factors in how likely a consumer is to save their earnings.
- Wealth or credit - an increase in wealth means a potential increase in consumption.
-
Investment expenditures are primarily affected by expectations about the future. Business investment is the most variable of all the components of aggregate demand
- Expectations of future profits. If the firm perceives a growing market, they are more likely to invest.
- Interest rates and investment costs - lower interest rates and costs means that businesses invest more.
-
Government policy plays a role in shifting aggregate demand
- More government spending = more demand.
- Higher taxes = lower demand.
-
Net exports are determined by the following
- Changes in relative growth rates between countries. If a country is in a recession, exports are likely to decline.
- Changes in relative prices between countries. If goods become relatively expensive, then exports are likely to decline
- Net inflow = trade deficit; Net outflow = trade surplus.
-
Recessions happen for two reasons
- Aggregate demand is not always automatically high enough to provide firms with an incentive to hire enough workers to reach full employment
- Sticky wages and prices means that the macroeconomy adjusts slowly 1.
- One such reason is the relative coordination argument.
- Sticky prices arise because of costs.(1) It costs resources to dictate a new price; (2) Menu costs mean there is a cost for changing the price
-
The expenditure multiplier means that a change in spending causes a more than proportionate change in GDP. This arises because one person’s spending is another person’s income which leads to more income and spending.
-
The Phillips Curve suggests that when the level of output is at or even pushing beyond potential GDP, the economy is at a greater risk for inflation. Thus, there is a tradeoff between unemployment rate and inflation rate
- The Philips curve is downward sloping in this case.
- The Phillips curve is unstable. Trying to balance unemployment and inflation leads to stagflation where both unemployment and inflation are high.
- The Phillips curve is valid in short periods, but when aggregate supply shifts over long periods, it shifts.
-
Keynesians argue that the solution to a recession and high unemployment is an expansionary fiscal policy that can stimulate consumption and investment
-
A proposed solution for high inflation is a contractionary fiscal policy where tax increases or spending cuts reduce consumption and investment.
-
Regardless, Keynesian policies require knowing how much aggregate demand there is in the moment.
-
It also risks ignoring the long term factors contributing to economic growth or the natural unemployment rate that exists even when the economy is producing at potential GDP.
-
It views inflation as a price for lower unemployment.
Neoclassical Perspective
-
Say’s Law: Supply creates its own Demand.
- Each time a good is produced and sold, it generate income earned by someone.
- Note that this does not explain why recessions and high unemployment occurs
- It is a good approximation of the long-run behavior of the economy.
-
Neoclassical economists posit that the economy is often in the Neoclassical Zone of the AS/AD model.
-
The Neoclassical Perspective is built on two principles
- The potential GDP determines the economy’s size
- Long term economic growth is seen in increases in the quality of physical capital, human capital, and technology.
- Short term fluctuations around potential GDP exist, but in the long run, the potential GDP determines the economy’s size.
- In the long run, the AS curve is simply a vertical line at the potential GDP. Shifts in demand only lead to shifts in price level
- Wages and prices will adjust in a flexible manner so that the economy will adjust back to the potential GDP level of output.
- The economy cannot sustain production above its potential GDP in the long run
- Surges in aggregate demand that drive production to be above potential GDP causes an increase in price level rather than output.
- Because of flexible prices, the economy will rebound out of a recession on its own, or contract during an expansion.
- The potential GDP determines the economy’s size
-
The theory of rational expectations holds that people form the most accurate possible expectations about the future using all information available. In an economy where people have rational expectations, economic adjustments may happen quickly
-
Another theory is adaptive expectation - where people look at past experience and update their models accordingly.
-
There is always a temporary trade-off between inflation and unemployment; There is no permanent tradeoff.
- The Phillips curve from the Neoclassical perspective is a vertical line at the level of natural unemployment indicating inflation rate could be anything for as long as the economy is at the natural unemployment rate.
-
It advocates for hands off policies which proposes that over long-term, prices will stabilize on their own. Governments should worry about long-term growth and controlling inflation than on recession and unemployment
- Aggregate demand should be allowed to expand only to match the gradual shifts of aggregate supply to reduce the effects of inflation.
- Because of the Phillips curve, government policy is more concerned with the natural unemployment rate when the economy is operating at potential GDP. The goal is to reform the labor market to reduce the natural rate of unemployment.
-
The Neoclassical model is not helpful in explaining why unemployment is volatile over the short ter. It is also not helpful for economic depressions.
-
It views inflation as a cost with no gains in terms of lower unemployment.
Links
- Shapiro, MacDonald and Greenlaw - Ch 24 - 26
- Macroeconomic Goals